scICB Database Documentation
Introduction
The scICB (Single-Cell Immune Checkpoint Blockade) database is designed to support tumor and immunology research under the treatment of immune checkpoint blockade (ICB) therapy, particularly in analyzing pre-treatment and post-treatment, responsive and nonresponsive patients at the single-cell level. scICB provides a user-friendly interface and four major modules, each serving different analytical needs to explore the dynamic changes or predictive biomarkers during the ICB treatment. This document provides a detailed description of each module, its purpose, and instructions on how to use them effectively for research.
Overview of scICB
Module 1: Browse
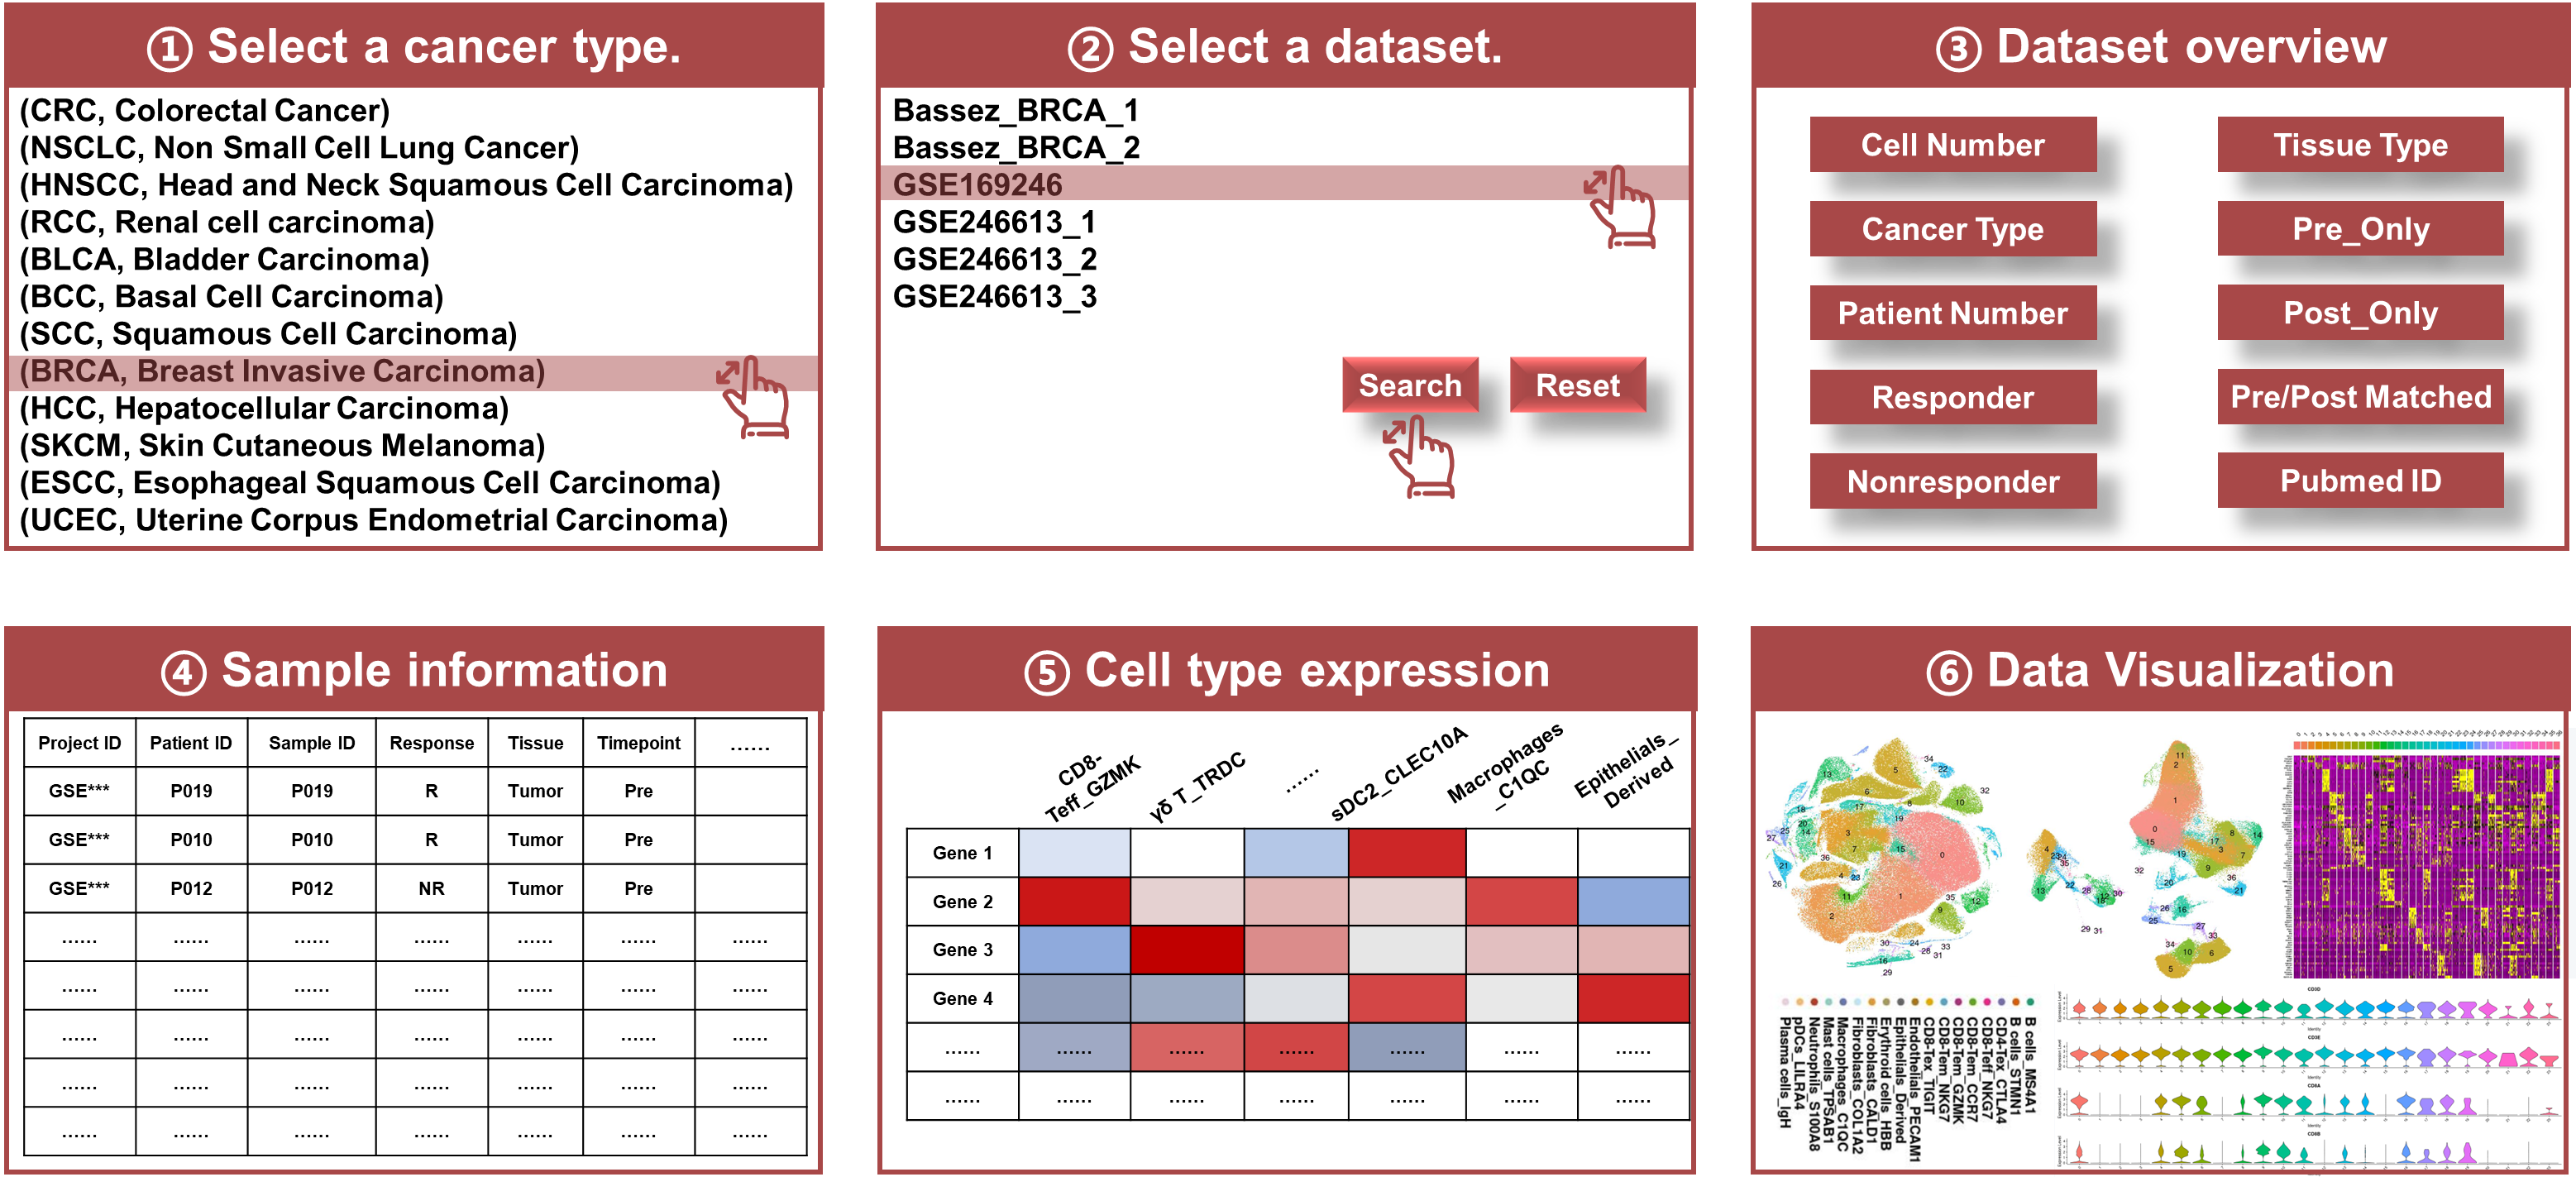
- Dataset Overview: A complete list of datasets with metadata including patient number, sample number, response status, timepoint the samples have been biopsied, tissue type, detailed cell type annotation and clinical metadata.
- Search and Filter: Flexible search options, enabling researchers to filter datasets based on various criteria (e.g., cancer type, dataset).
- Data Visualization: Built-in visualization tools to provide quick insights into the datasets, such as dimensionality reduction plots (UMAP, t-SNE), expression heatmaps, cell clustering and annotation information.
- Navigating the Browse Module: Upon accessing the Browse module, users will see a dashboard listing all available datasets.
- Search Functionality: Use the filtering options to refine results.
- Visualization: Click on the dataset of interest to view initial visualizations and access deeper analyses.
Purpose
The Browse module serves as the foundation of scICB, allowing users to explore all available datasets within the database. Each dataset includes critical information about cancer type, patient number, sample number, treatment, tissue type, response status, timepoint, associated clinical data and consensus single cell annotation. Researchers can search, browse visualize datasets and download that are most relevant to their studies.
Key Features
Usage Instructions
Module 2: Pre VS Post
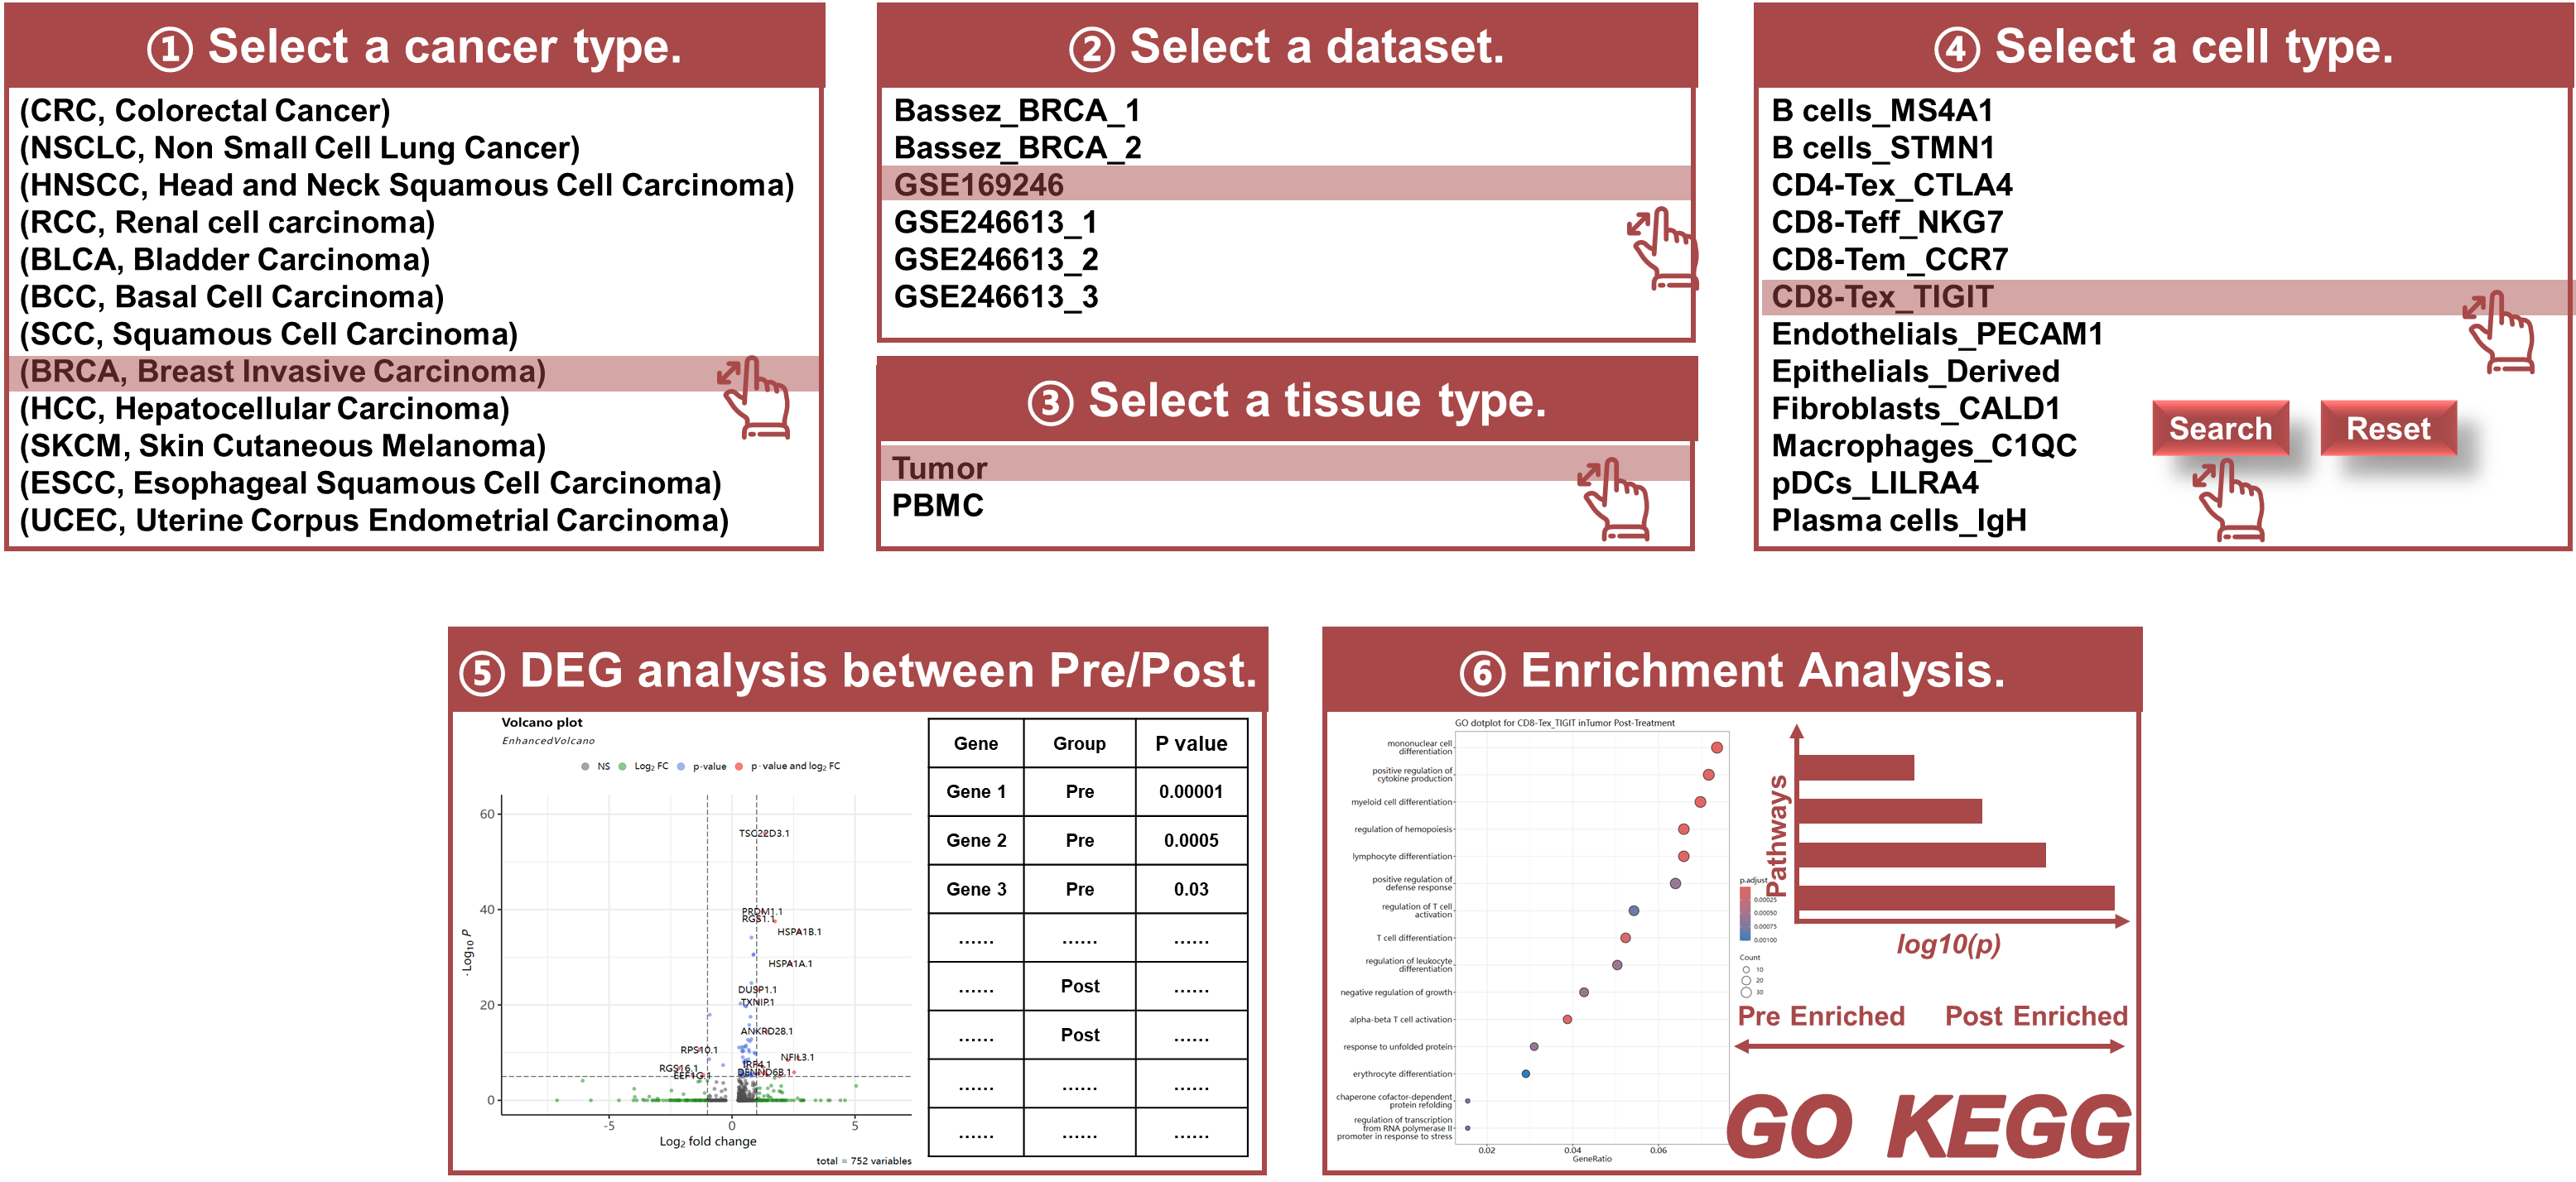
- Differential Expression Analysis: Identifies genes whose expression changes significantly between Pre and Post treatment groups.
- Visualization Tools: Volcano plots, differential gene expression table (fold change, p-values, and false discovery rates (FDR) to evaluate the significance of gene expression changes), enrichment analysis table, and dot plots to visualize differential gene expression patterns.
- Select a certain cancer type and datasets: Use the interface to select a certain cancer type and dataset available that has paired Pre and Post samples, a tissue type, and then a certain cell type of interest that has been annotated.
- Perform Differential Expression Analysis: Run the analysis to identify genes with significant expression differences between Pre and Post treatment.
- Browse the differential expression and enrichment analysis results: Click the button to see the volcano plot and enrichment dot plots.
- Download Results: The results can be downloaded as CSV or JPEG files for further analysis or publication.
Purpose
The PrePost module is specifically designed to compare gene expression profiles between pre-treatment (Pre) and post-treatment (Post) samples for Pre/Post matched patients. This analysis can help identify key genes that are up- or down-regulated during the ICB therapy, offering insights into the molecular mechanisms of response or resistance to treatment.
Key Features
Usage Instructions
Module 3: R VS NR
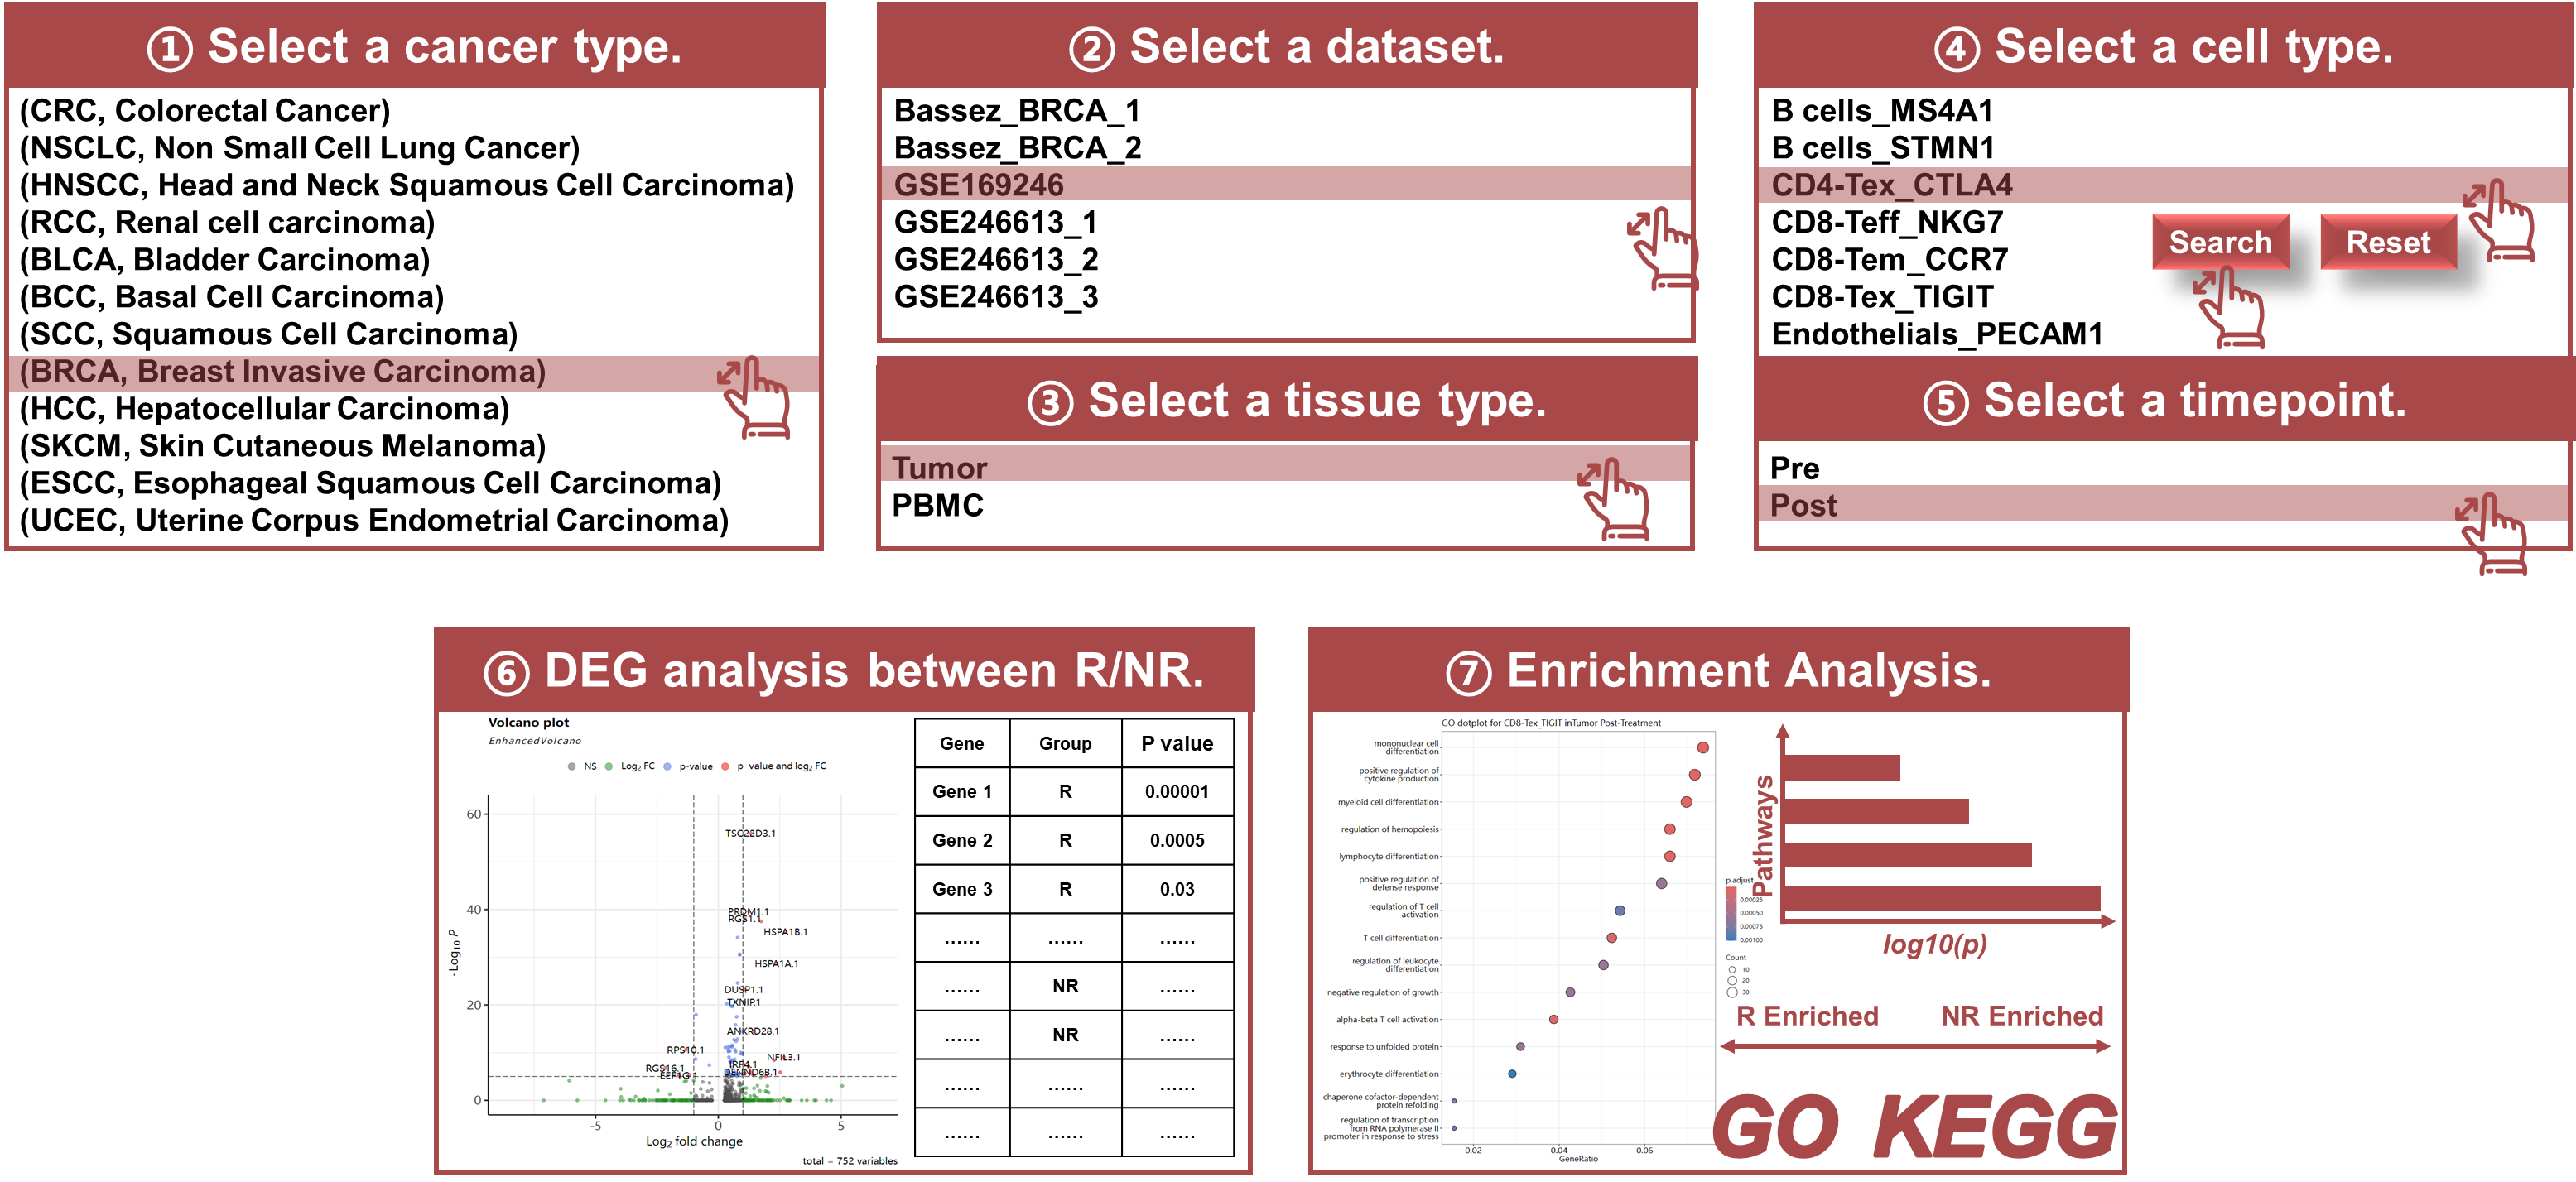
- Responder/Non-Responder Analysis: Compare gene expression differences between R and NR groups.
- Visualization Tools: Volcano plots, differential gene expression table (fold change, p-values, and false discovery rates (FDR) to evaluate the significance of gene expression changes), enrichment analysis table, and dot plots to visualize differential gene expression patterns.
- Statistical Comparison: Provides fold changes, p-values, and FDR values to assess significant differences.
- Select a certain cancer type and datasets: Use the interface to select a certain cancer type and dataset available, a tissue type, and then a certain cell type of interest that has been annotated.
- Select a specific timepoint at which the samples have been biopsied: Specify the sample biopsy timepoint. For pre-treatment samples, this step examines the baseline immune status predictive of the response to ICB. For post-treatment samples, it studies the gene expression patterns after the ICB treatment.
- Perform Differential Expression Analysis: Run the analysis to identify genes with significant expression differences between R and NR groups.
- Browse the differential expression and enrichment analysis results: Click the button to see the volcano plot and enrichment dot plots.
- Download Results: The results can be downloaded as CSV or JPEG files for further analysis or publication.
Purpose
The R VS NR module enables researchers to conduct differential gene expression analysis between responders (R) and non-responders (NR). This module is crucial for identifying biomarkers of response, helping researchers better understand why some patients benefit from ICB therapy while others do not.
Key Features
Usage Instructions
Module 4: GeneSet
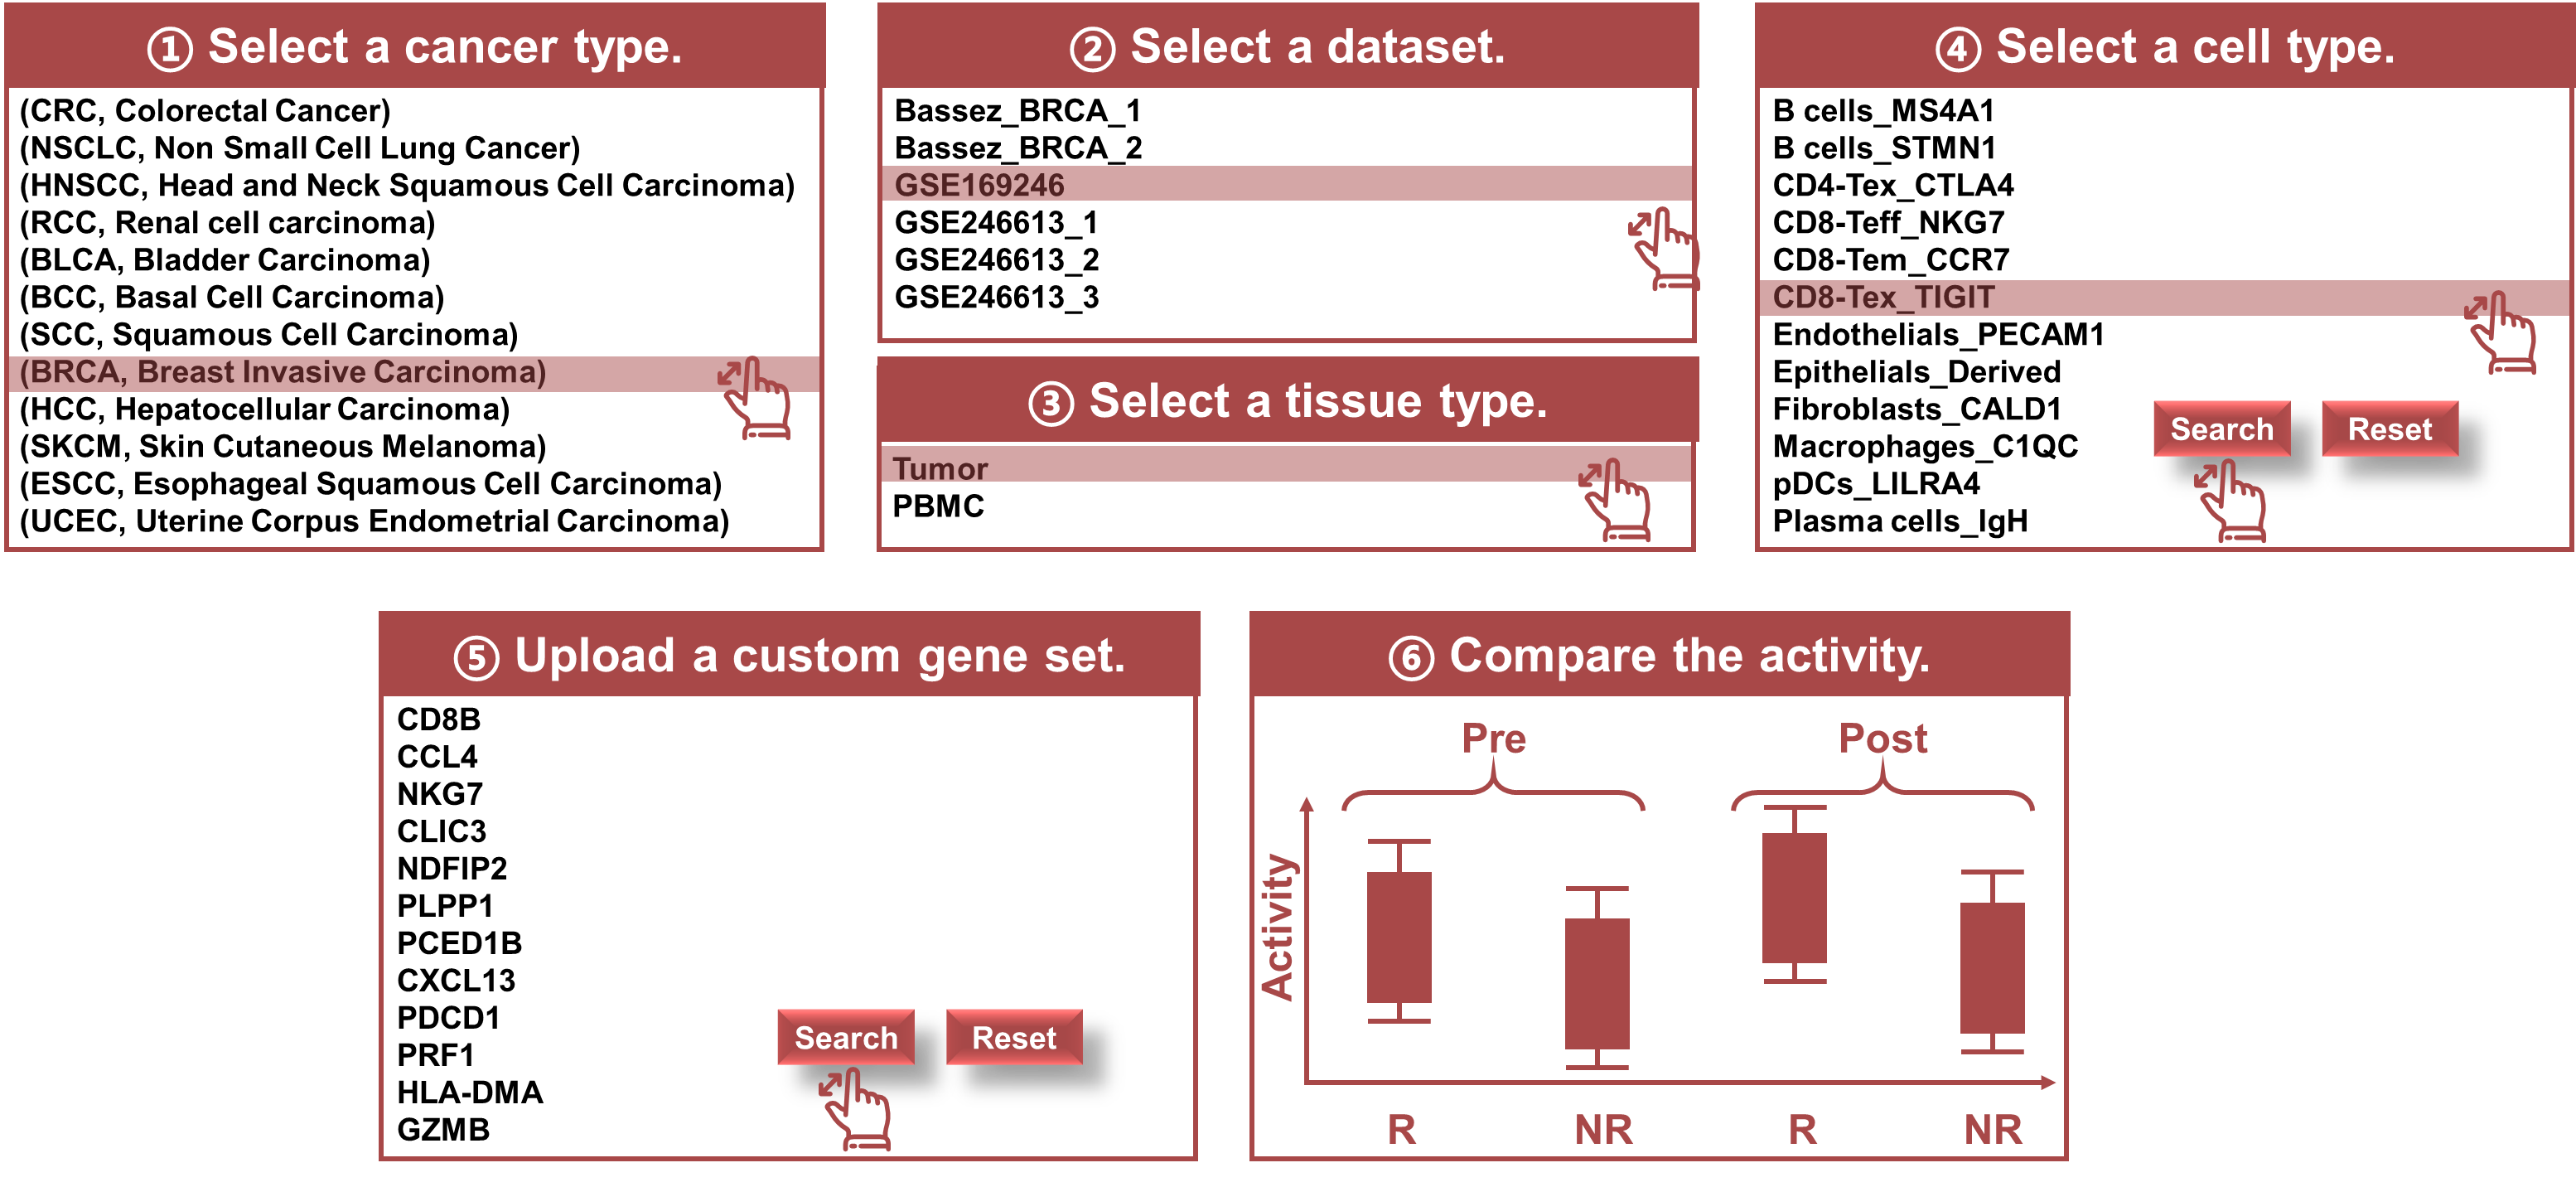
- Gene Set Analysis: Allows users to input custom gene sets or use predefined sets from databases such as MSigDB or KEGG.
- Pathway Activity Comparison: Measures pathway activity differences across sample groups (e.g., Pre/Post, R/NR).
- Select Gene Set or Pathway: Input custom gene sets or select predefined pathways available within the module.
- Interpretation of Results: Examine the relative activity scores and statistical metrics to identify significant pathways that differ between groups.
Purpose
The GeneSet module offers functionality to assess the relative activity of specific gene sets or pathways across different groups of samples. This module is highly useful for pathway-level analysis, allowing researchers to explore whether certain biological processes or pathways are enriched or depleted in different conditions (e.g., Pre vs. Post, R vs. NR).
Key Features
Usage Instructions
Data Download and Export Options
Each module provides options for users to export results in multiple formats including CSV, TIFF, or JPEG. Users can also download the Seurat file for each dataset with detailed data annotation information. This allows users to take results from scICB for further analysis using their preferred tools or for integration into external platforms.
Conclusion
The scICB database provides a comprehensive platform for the exploration and analysis of single-cell data in the context of immune checkpoint blockade therapy. Each module offers powerful, user-friendly tools that enable researchers to investigate the molecular mechanisms underlying response and resistance to ICB. By facilitating differential gene expression analysis and pathway activity evaluation, scICB supports the discovery of biomarkers and potential therapeutic targets. For any inquiries, feedback, or technical assistance, please contact our support team at jifansen@mail.tsinghua.edu.cn.